Dataiku
BRINGING DATA TO LIFE WITH AI-POWERED PRESENTATIONS

01 Theming system
CHALLENGE
Dataiku Stories needed a flexible theming system to maintain visual consistency across presentations. Without proper architecture, teams were duplicating styles across elements and presentations, breaking brand consistency and making global updates nearly impossible. The system needed to handle enterprise requirements: concurrent editing, brand compliance and seamless theme portability across presentations, teams and instances.
SOLUTION
I designed a theming engine inspired by CSS specificity rules, using a cascading 3-tier selector hierarchy: entity.type.variant (e.g. element.chart.pie). The system enables granular styling of 80+ properties across diverse component types including charts, text, shapes and slides. Themes compile into optimized lookup tables at runtime, providing O(1) access and instant style resolution for optimal rendering performance.
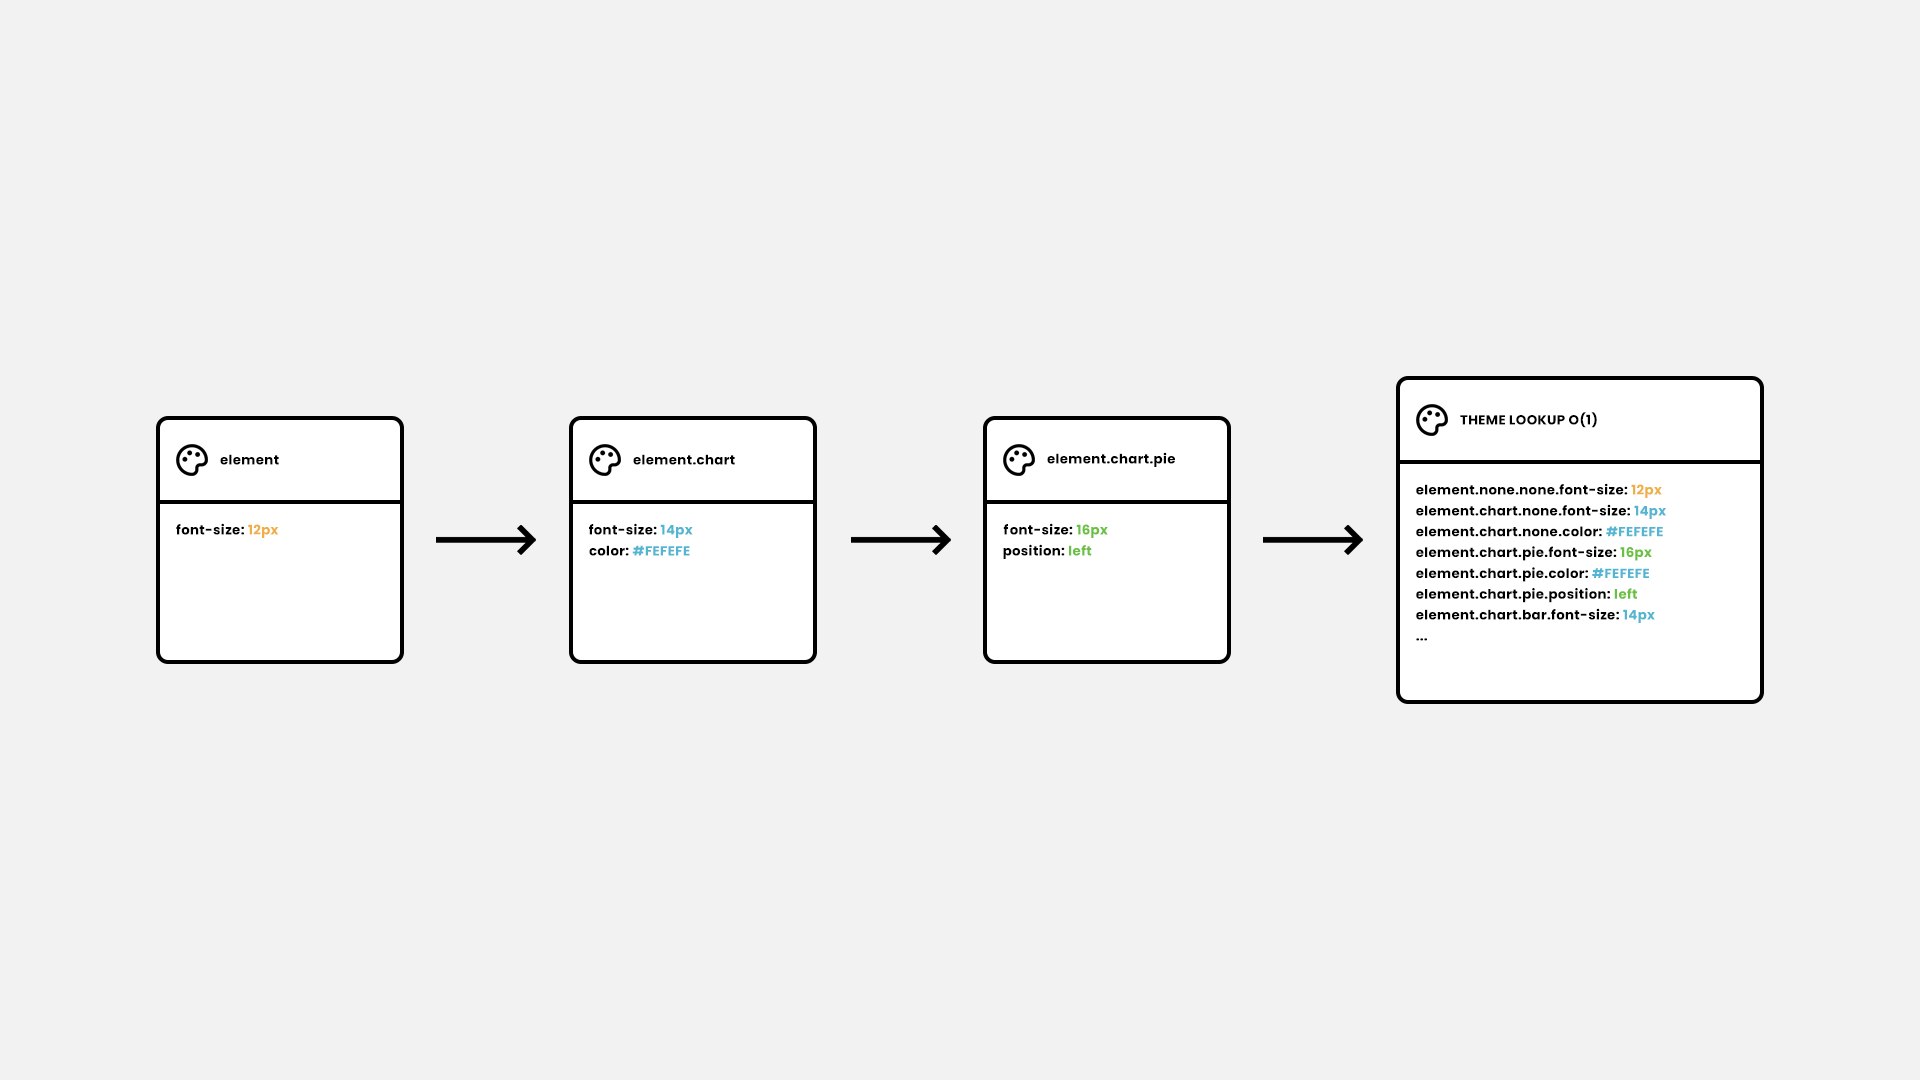
The architecture treats themes as denormalized snapshots rather than live references. When capturing styles from any source, the system stores complete primitive values; a palette reference becomes an array of hex colors. This eliminates entire categories of bugs: unintended propagation, broken references and inconsistent resolution.
The "downside" of themes not auto-updating when sources change is actually the feature
The "downside" of themes not auto-updating when sources change is actually the feature: themes are deterministic artifacts that work identically across presentations, teams and instances. This deliberate trade-off ensures true portability and predictable behavior.

Themes are flat arrays of style rules; no hierarchies or inheritance chains. Users create themes by example through a bidirectional engine: apply a theme to elements, or capture an element's styles into a theme. Selecting a preset theme replaces your current styles with a clean copy; capturing from an element appends to the existing styles array. The same model that handles a single font size change can rebrand an entire presentation.
For state management, I built a Redux-based system with complete undo/redo for all theme operations. Each action captures state diffs while a WebSocket layer broadcasts changes for real-time collaboration across multiple editors.
RESULT
The theming system powers thousands of enterprise presentations with near-zero bugs since deployment. Teams rebrand entire presentation libraries in minutes. What required updating hundreds of individual elements now happens with one theme change. Any user can create themes by styling elements directly, then exporting them. Administrators add these to the organization's library or set them as defaults. Real-time collaboration just works. The simple architecture proves its worth daily: new properties ship without core engine changes, keeping the system fast and maintainable as Dataiku Stories evolves.
02 GenAI integration
CHALLENGE
Dataiku Stories needed generative AI capabilities to compete in the modern presentation market. We had no existing AI infrastructure and only a few months before our critical Gartner demo.
SOLUTION
I initiated Dataiku Stories' first Python/LangChain project, bootstrapping our AI exploration. From there, I built a frontend-AI bridge that translates LLM actions (e.g. add_slide, add_chart and add_text) into frontend actions, seamlessly integrating AI with our existing system.
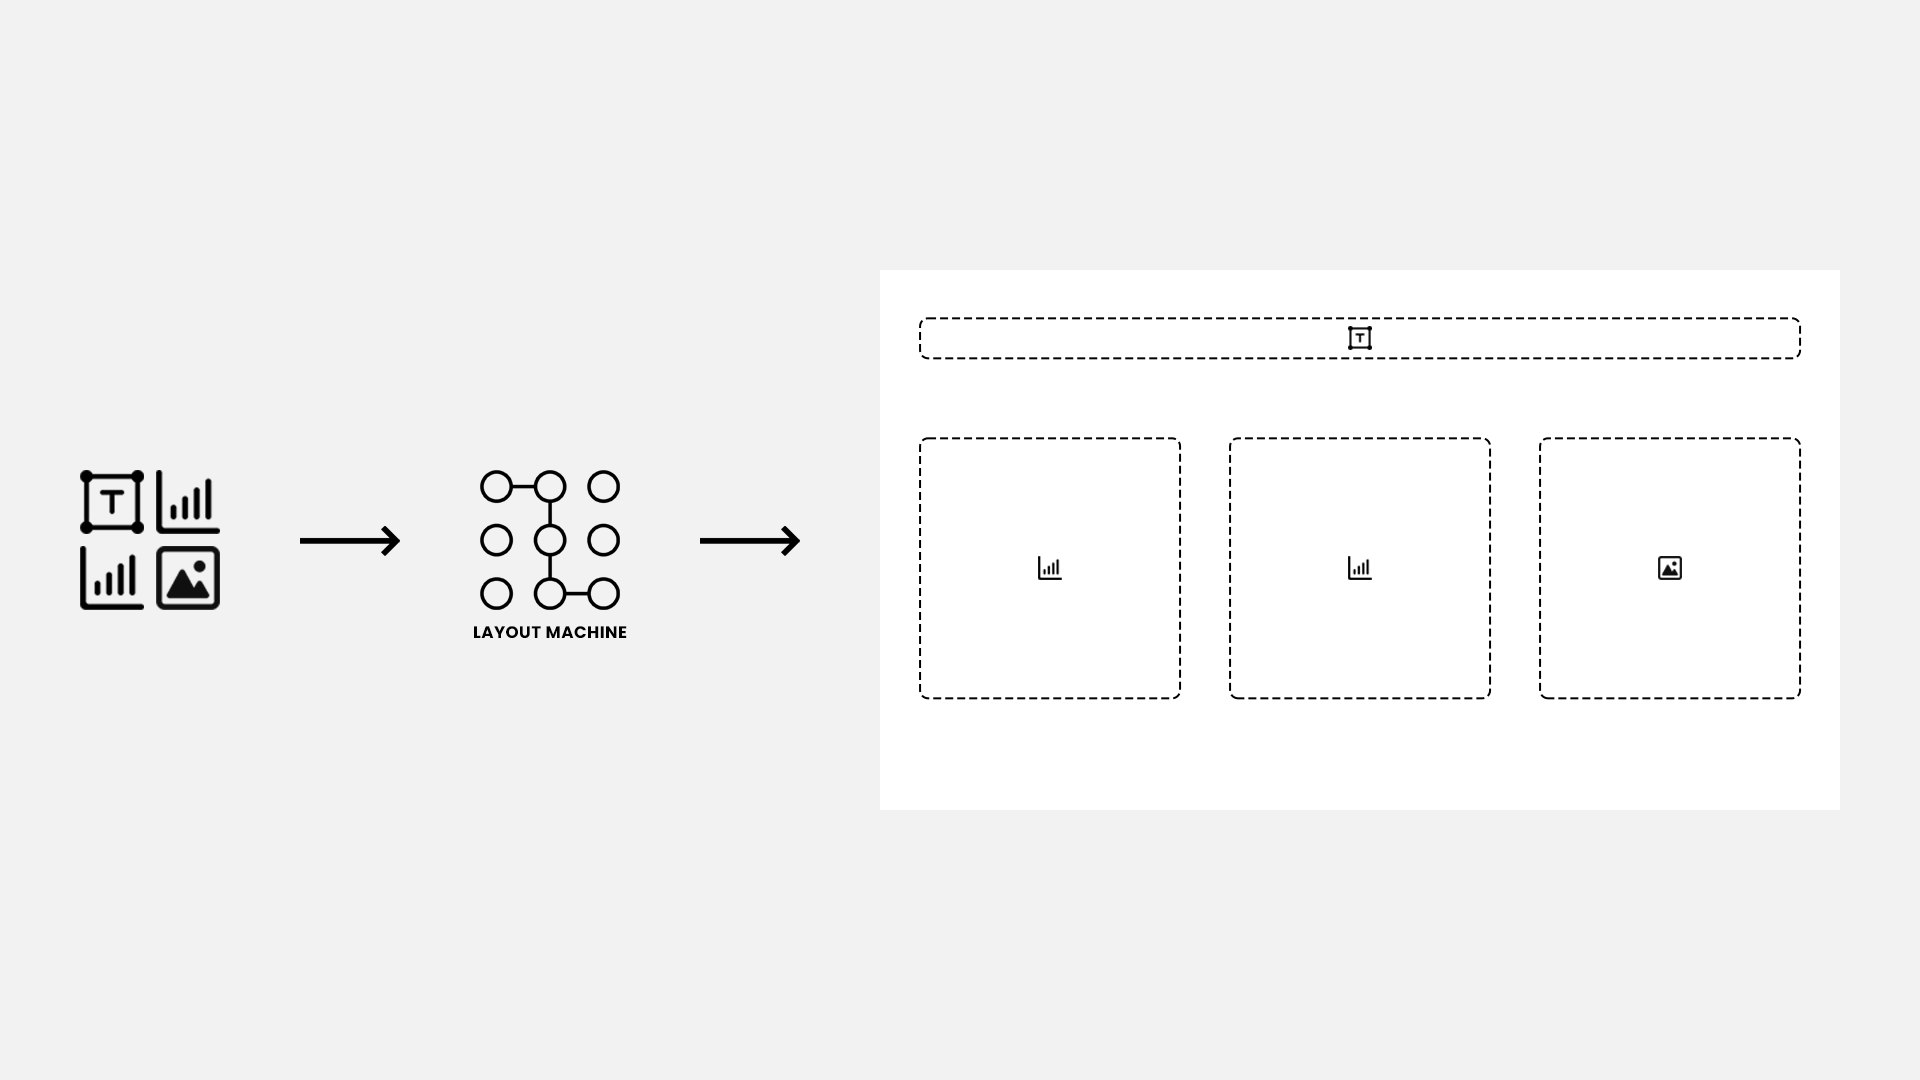
To solve the presentation assistant's spatial reasoning challenge, I designed a system with 16 pre-defined layouts and a matching algorithm. When the assistant requests elements (e.g. 1 title + 2 charts + 1 image), the system finds the best-fitting layout through iterative search. This eliminated spatial errors completely, ensuring professional positioning regardless of content complexity. It remains unchanged in production and inspired the upcoming user-facing layout feature.
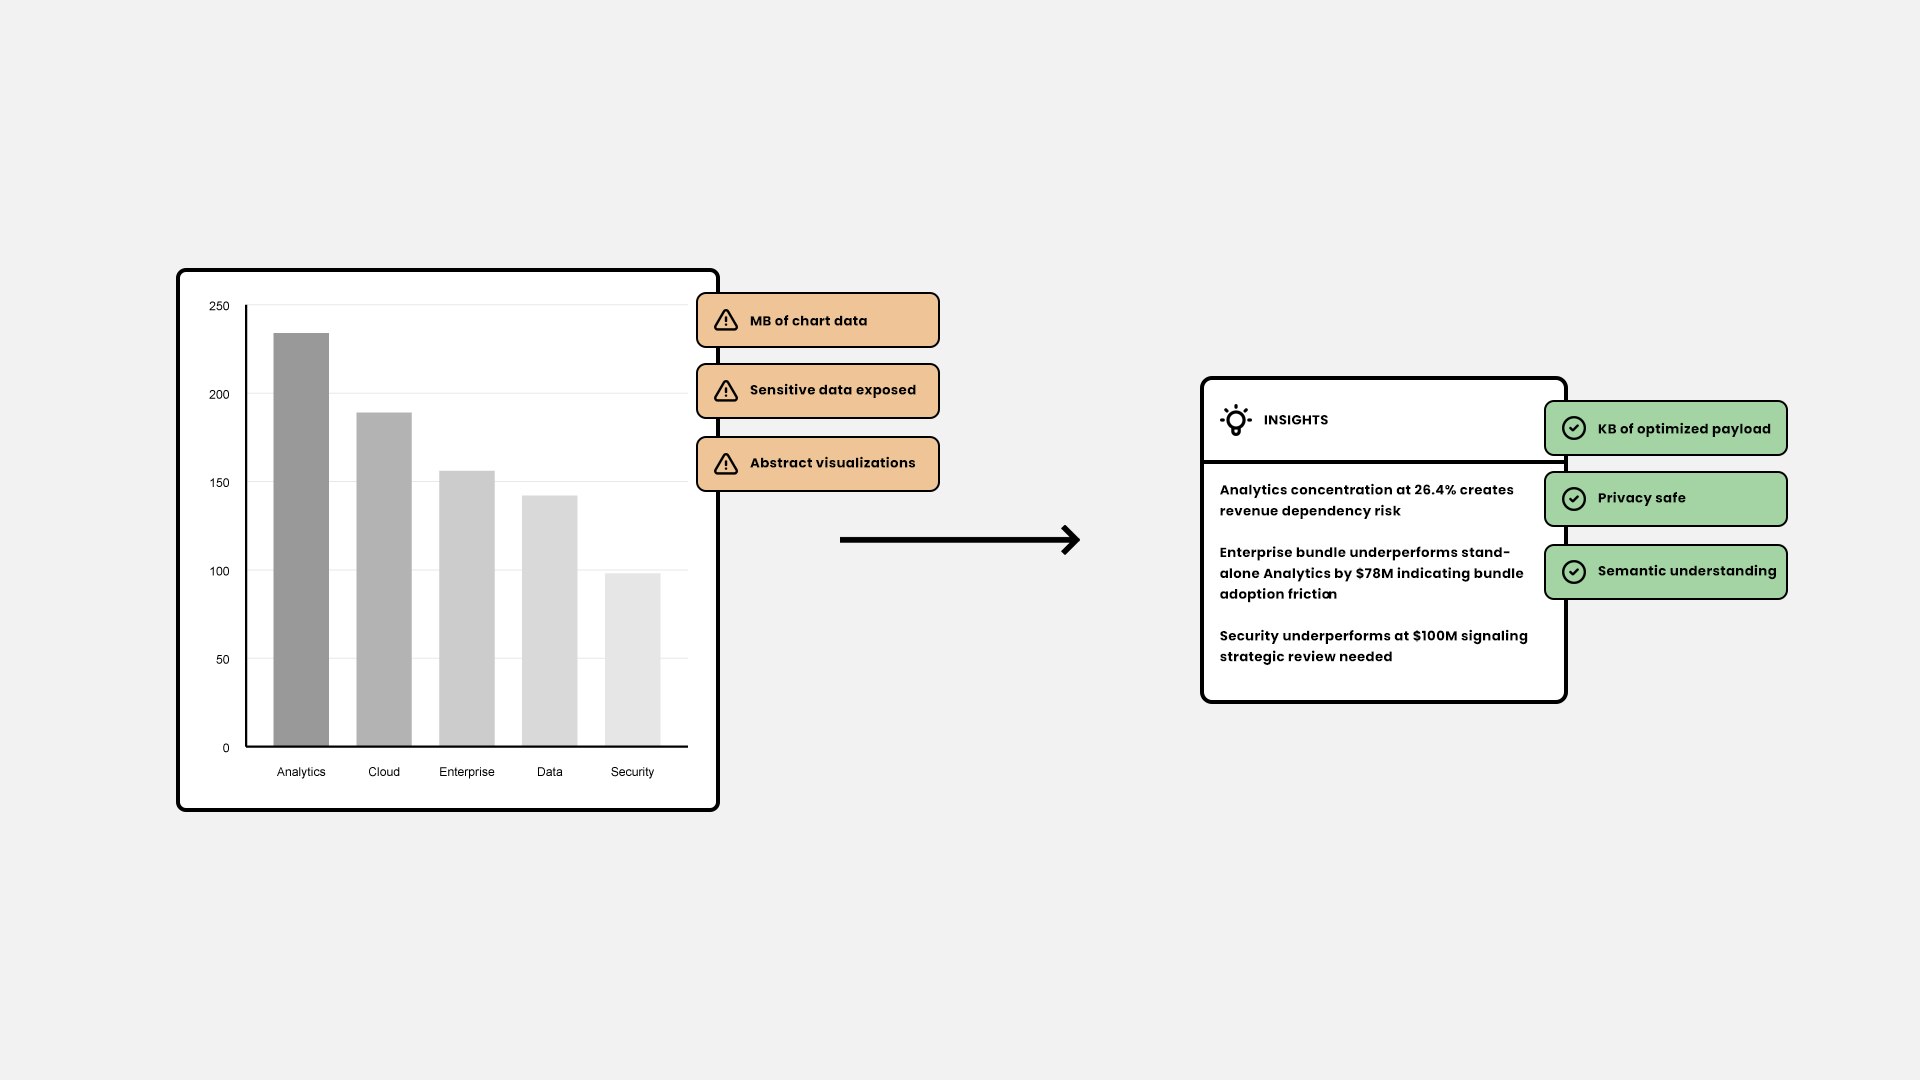
The chart insights feature I created uses AI to interpret data visualizations. Instead of sending raw data to the LLM, I used aggregated statistics and metadata. This approach solved three critical issues. It bypassed token limits by reducing context from megabytes to kilobytes, protected sensitive data by never exposing raw values and maintained insight quality through semantic understanding of abstract visualizations.
RESULT
The AI features successfully powered our Gartner demo, helping secure Dataiku's leader position in the Magic Quadrant. The frontend bridge and layout system I built enabled flawless slide generation. Chart insights help users derive meaningful insights from complex visualizations.